wandb leet terminal UI locally.
- W&B App
- LEET
To view a specific run in the W&B App:Replace the bracketed placeholders with the actual values of the team name, project name, and run ID.Explore the run’s properties by navigating through the tabs: Overview, Logs, Files, Code, and Artifacts.
- Navigate to the W&B App.
- Navigate to the W&B project you specified when you initialized the run.
- Within the project sidebar, select the Workspace tab.
- Within the run selector, select the run you want to view, or enter a partial run name to filter for matching runs.
Overview
Use the Overview tab to learn about specific run information in a project, such as:- References: Dictionary keys from your experiment’s config that you want to show prominently in the W&B App. See Highlight config values for more details.
- Notes: Any notes you added to the run. You can add notes to a run with the W&B App or programmatically with the Python SDK.
- Tags: A list of strings. Tags are useful for organizing related runs together or applying temporary labels like
baselineorproduction. You can add tags to a run with the W&B App or programmatically with the Python SDK. - Author: The W&B entity that created the run.
- Command: The command that initialized the run.
- Description: A description of the run that you provided. If you don’t specify a description when you create the run, this field is empty. You can add a description to a run with the W&B App or programmatically with the Python SDK.
- Tracked Hours: The amount of time the run actively computes or logs data, excluding any pauses or waiting periods. This metric helps you understand the actual computational time spent on your run. W&B doesn’t bill you for tracked hours, which are unlimited for all plans.
- Runtime: The total time from the start to the end of the run. It’s the wall-clock time for the run, including any time when the run is paused or waiting for resources. This metric provides the complete elapsed time for your run.
- Git repository: The Git repository associated with the run. To view this field, you must enable Git.
- Host name: Where W&B computes the run. If you initialize the run locally on your machine, W&B displays the name of your machine.
- Name: The name of the run.
- OS: The operating system that initialized the run.
- Python executable: The command that starts the run.
- Python version: The Python version that created the run.
- Run path: The unique run identifier in the form
entity/project/run-ID. - Start time: The timestamp when you initialize the run.
- State: The state of the run.
- System hardware: The hardware W&B uses to compute the run.
- W&B CLI version: The W&B CLI version installed on the machine that hosts the run command.
- Git state: The most recent Git commit SHA of a repository or working directory where you initialized the run. If you don’t enable Git when you create the run, or if the Git information isn’t available, this field is empty.
- Artifact Outputs: Artifact outputs that the run produces.
- Config: List of config parameters saved with
wandb.Run.config. - Summary: List of summary parameters saved with
wandb.Run.log(). By default, W&B sets this value to the last value logged.
acc in the search box, W&B filters for all parameters with acc in their name such as accuracy and val_acc.
W&B doesn’t search for nested config or summary parameters. For example, if you log a nested config parameter with
wandb.Run.config.update({"model": {"learning_rate": 0.01}}), W&B doesn’t return the learning_rate parameter if you search for learning_rate in the search box. You can only find the learning_rate parameter by searching for model.Logs
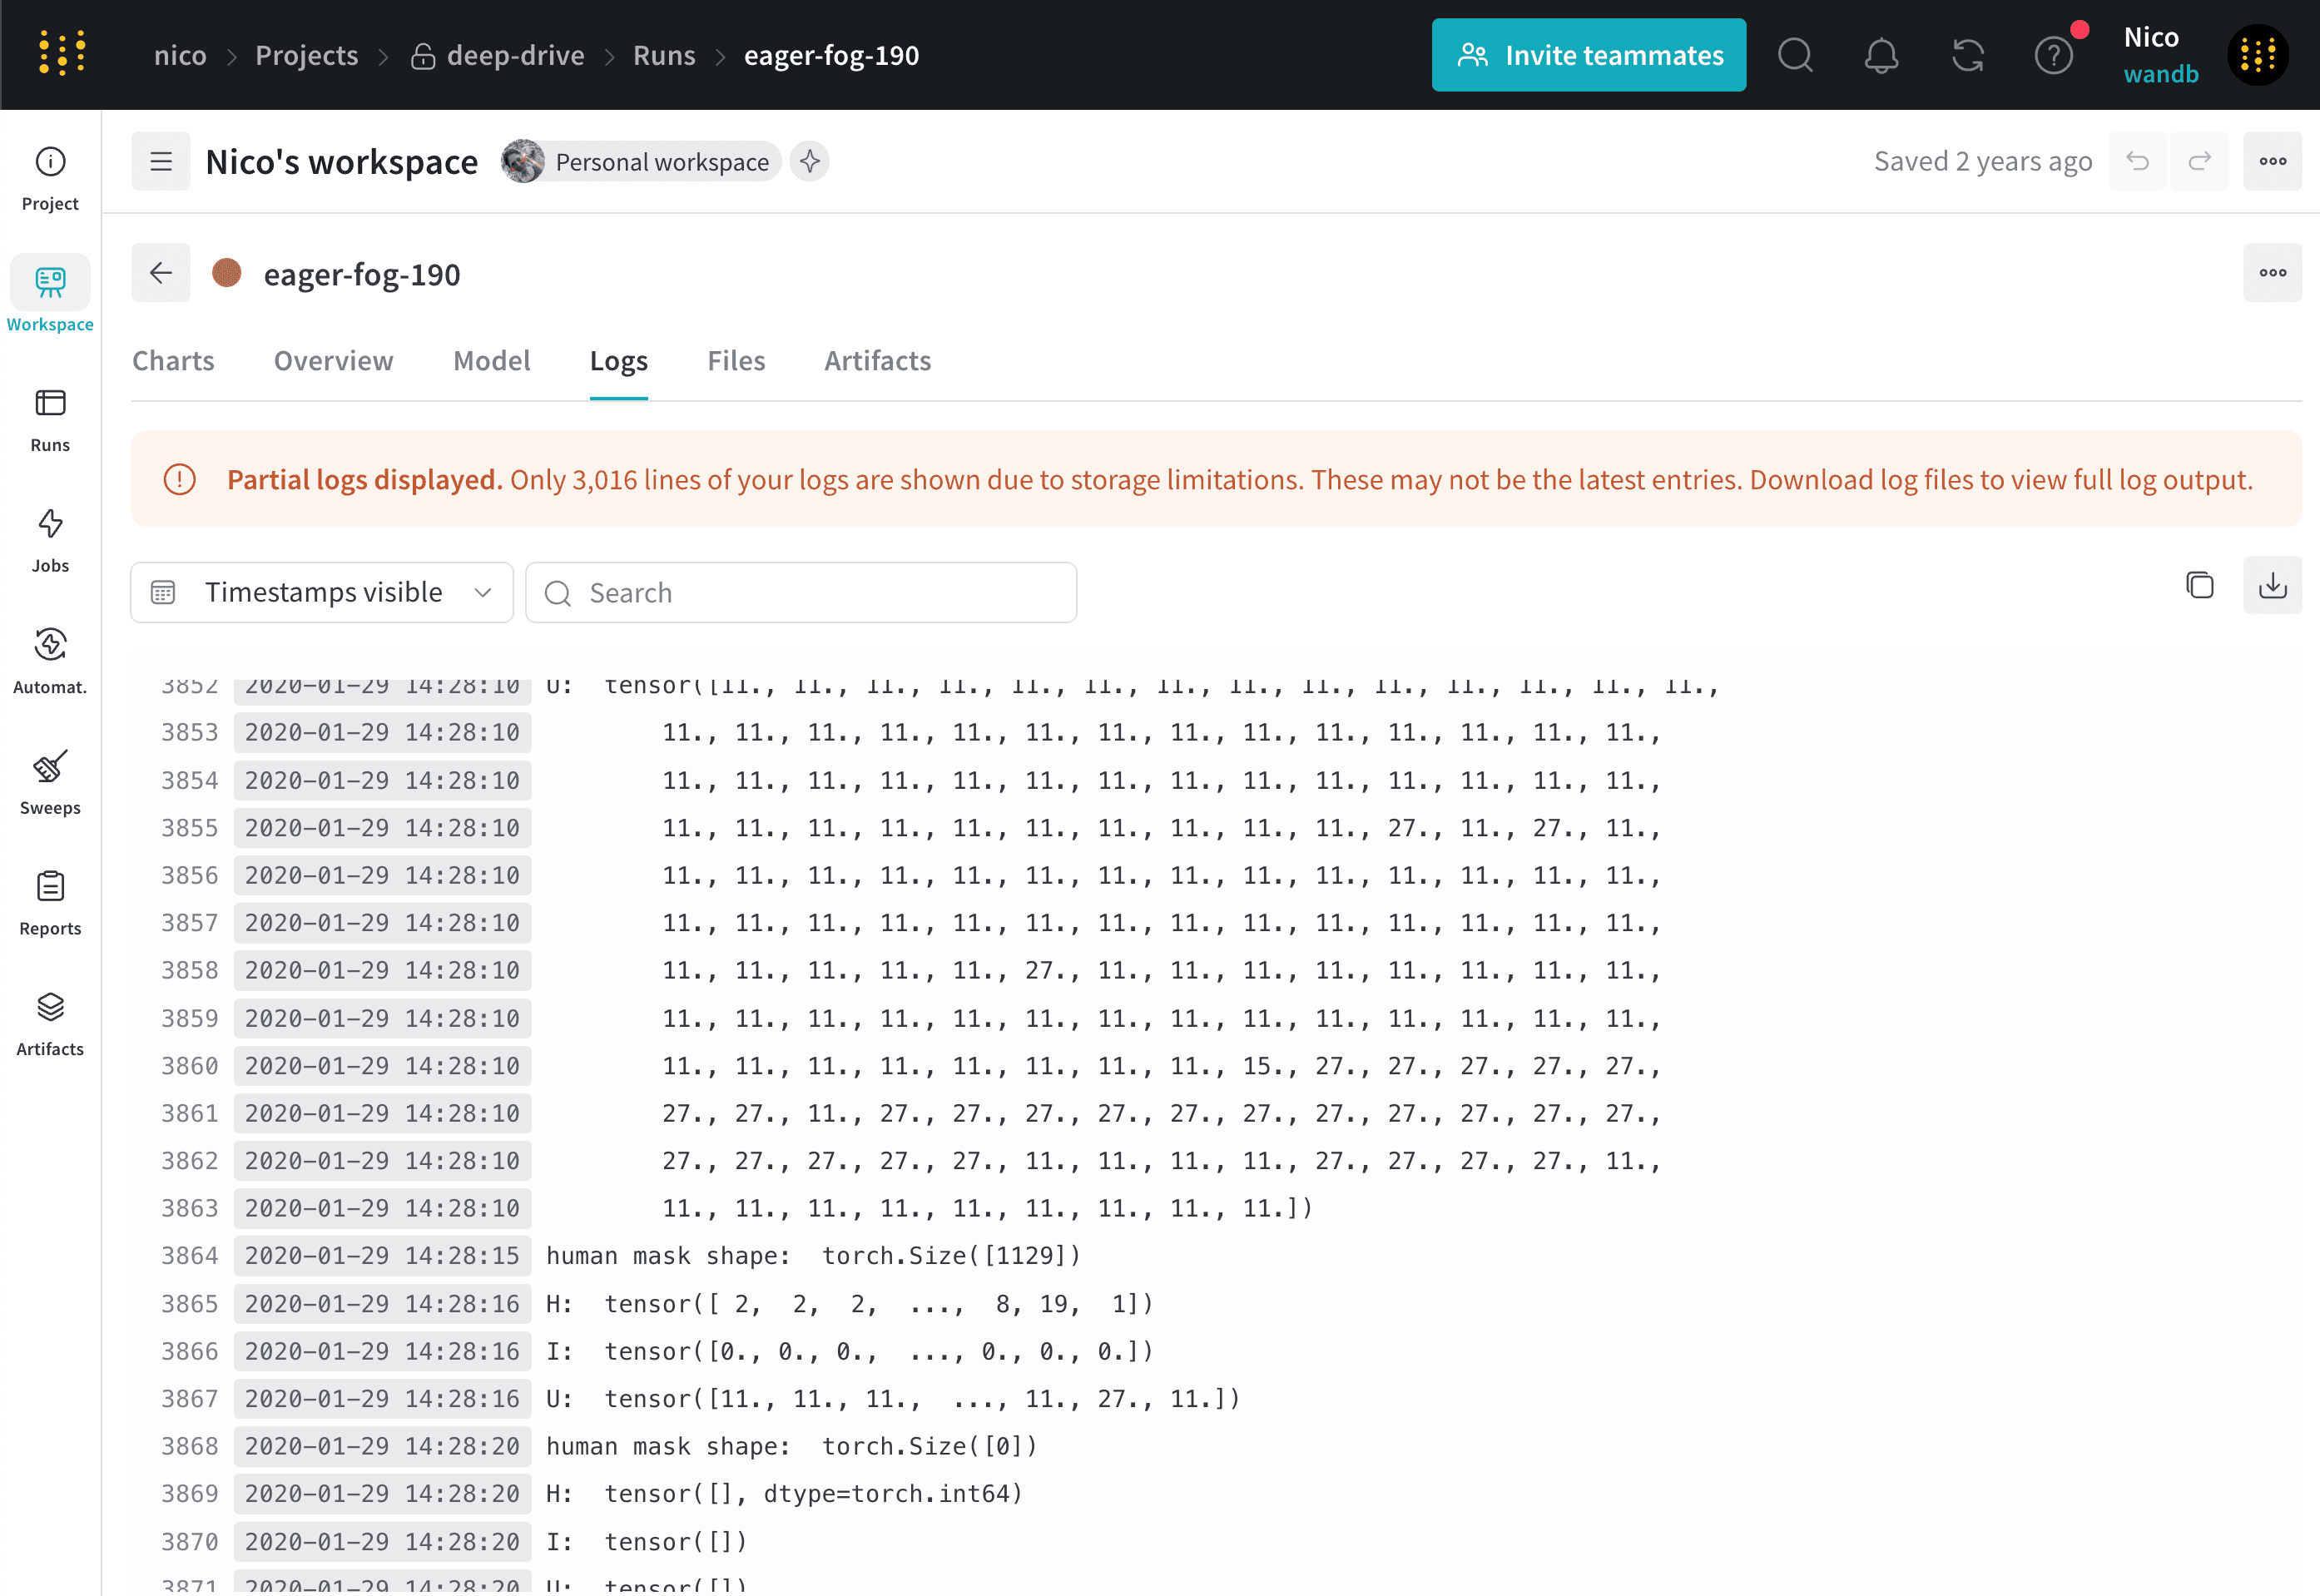
The Logs tab shows output that the command line prints, such as the standard output (stdout) and standard error (stderr).
Files
Use the Files tab to view files associated with a specific run, such as model checkpoints, validation set examples, and more.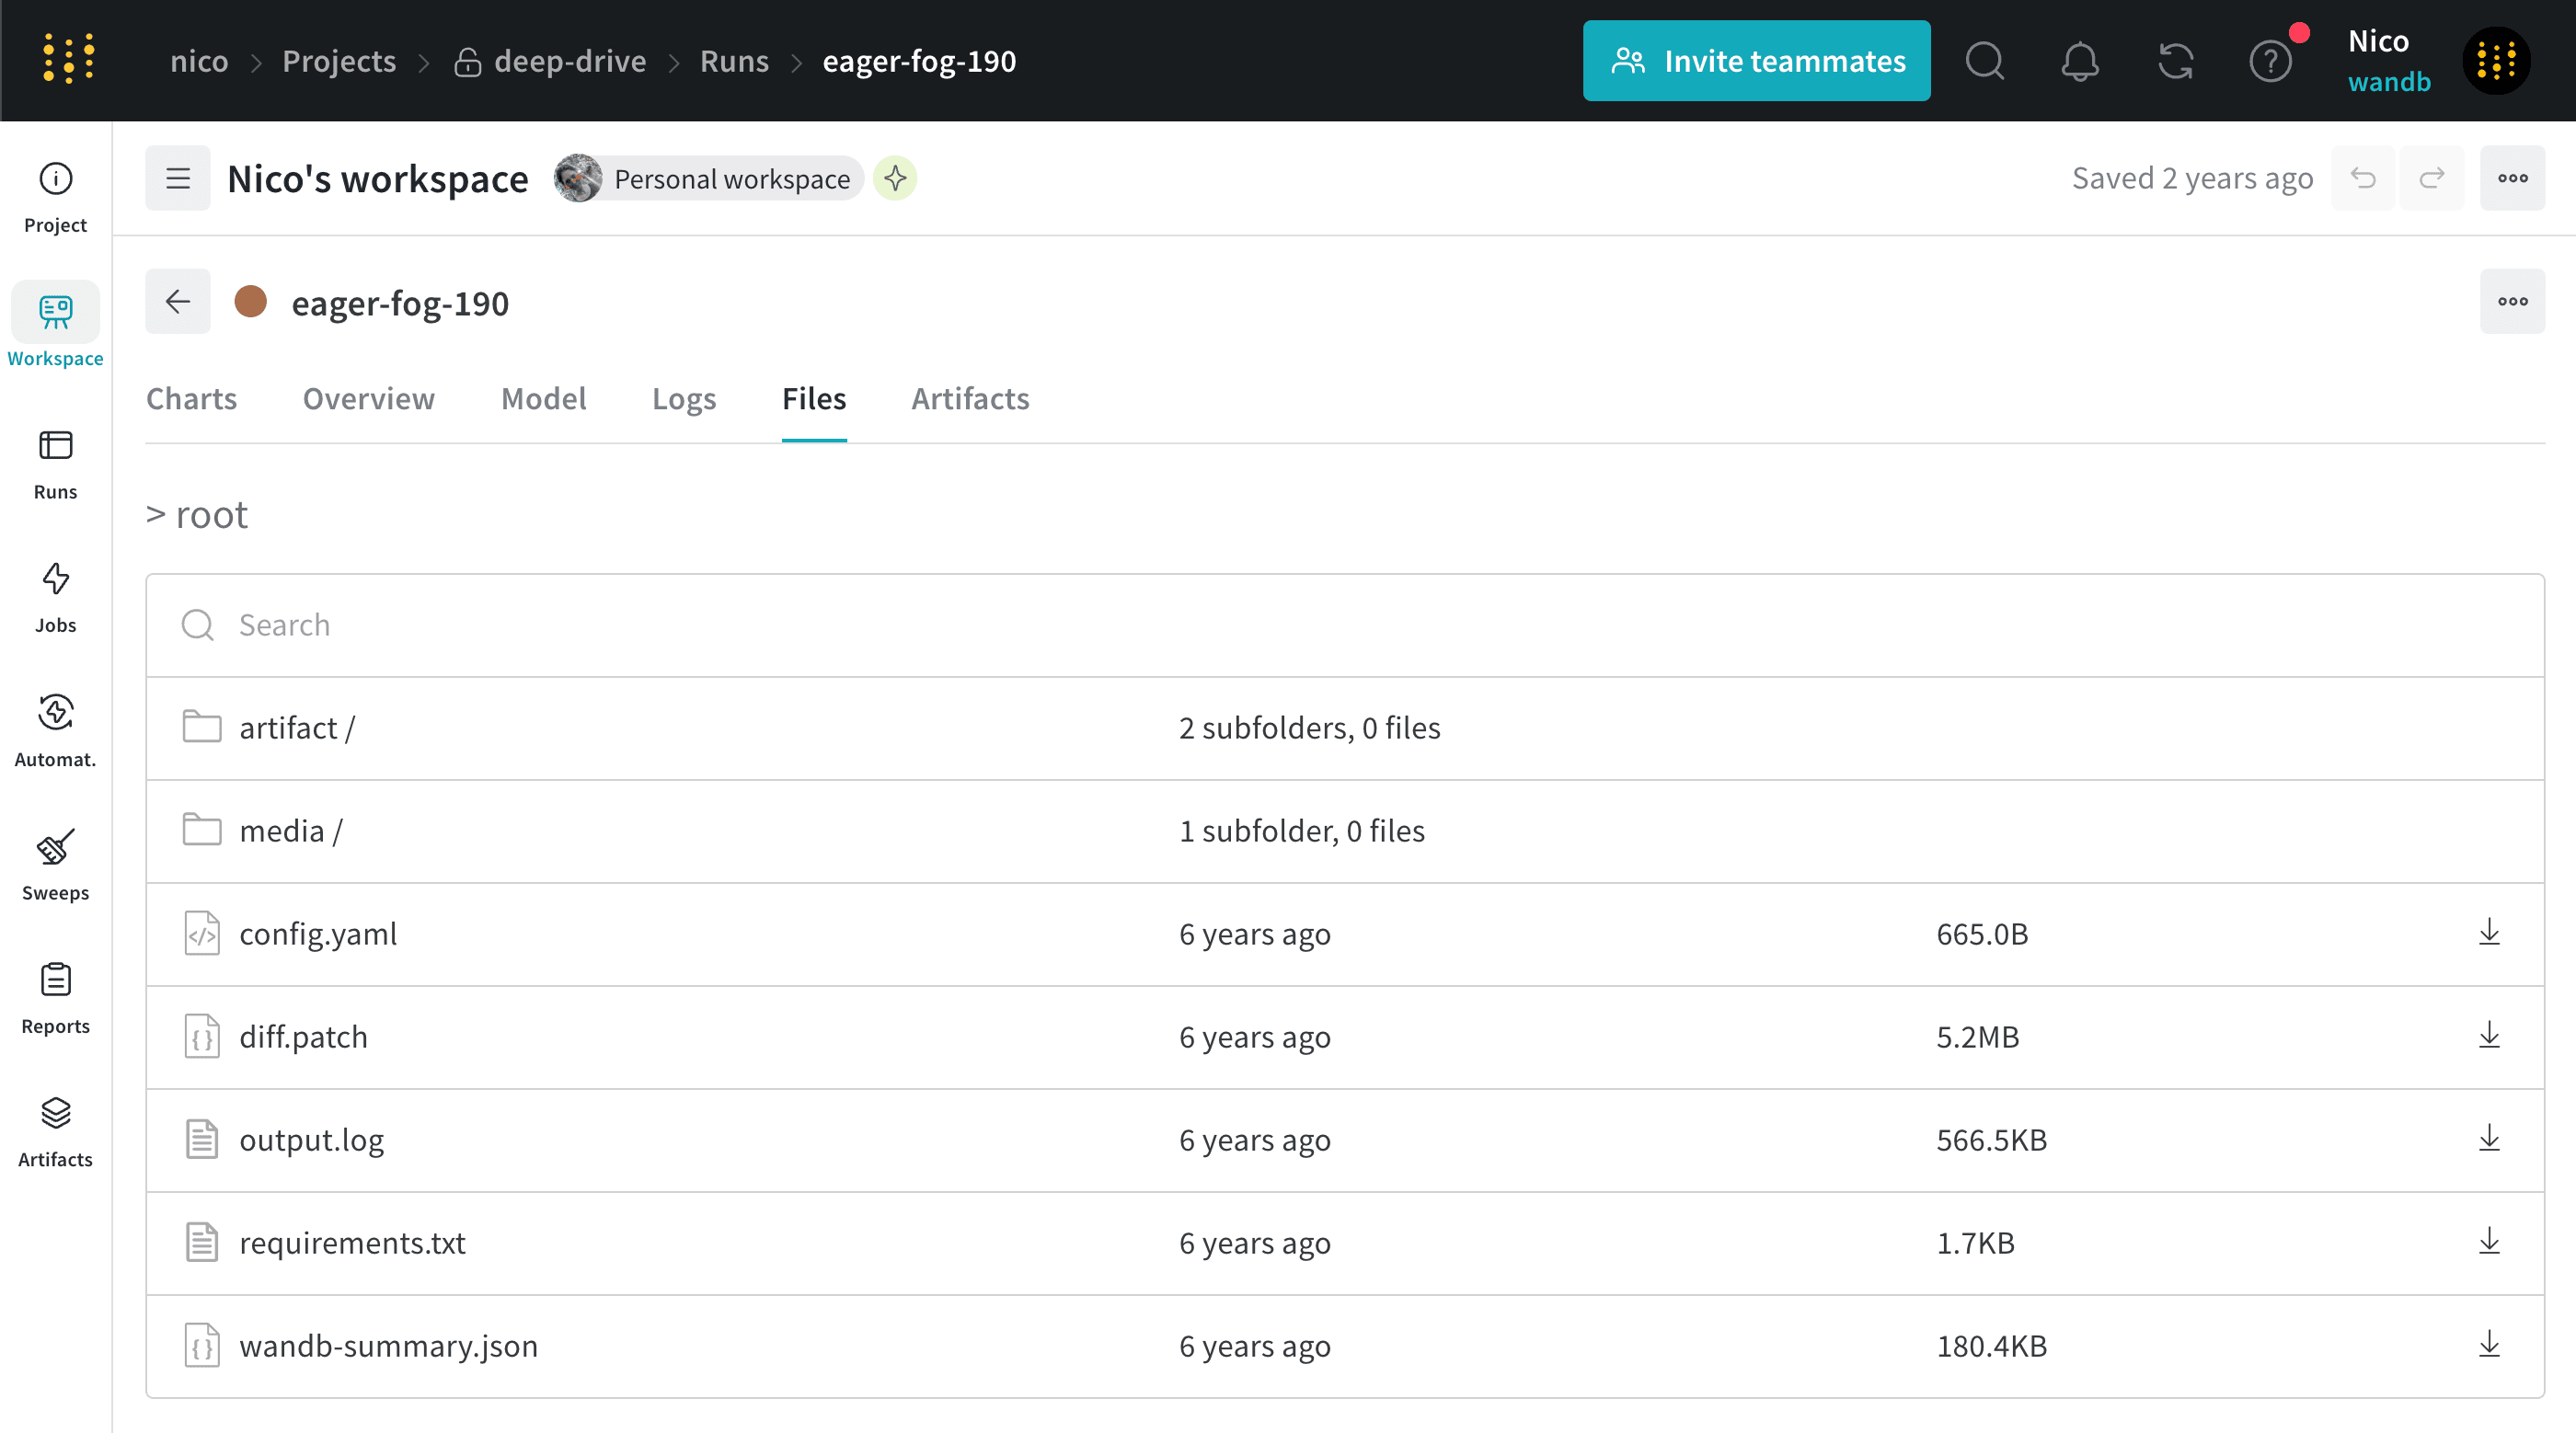
Code
The Code tab displays the code files associated with a specific run, including the main script and any additional code files in the run’s environment. Reviewing these files helps you reproduce the run or trace results back to the exact code that produced them.Artifacts
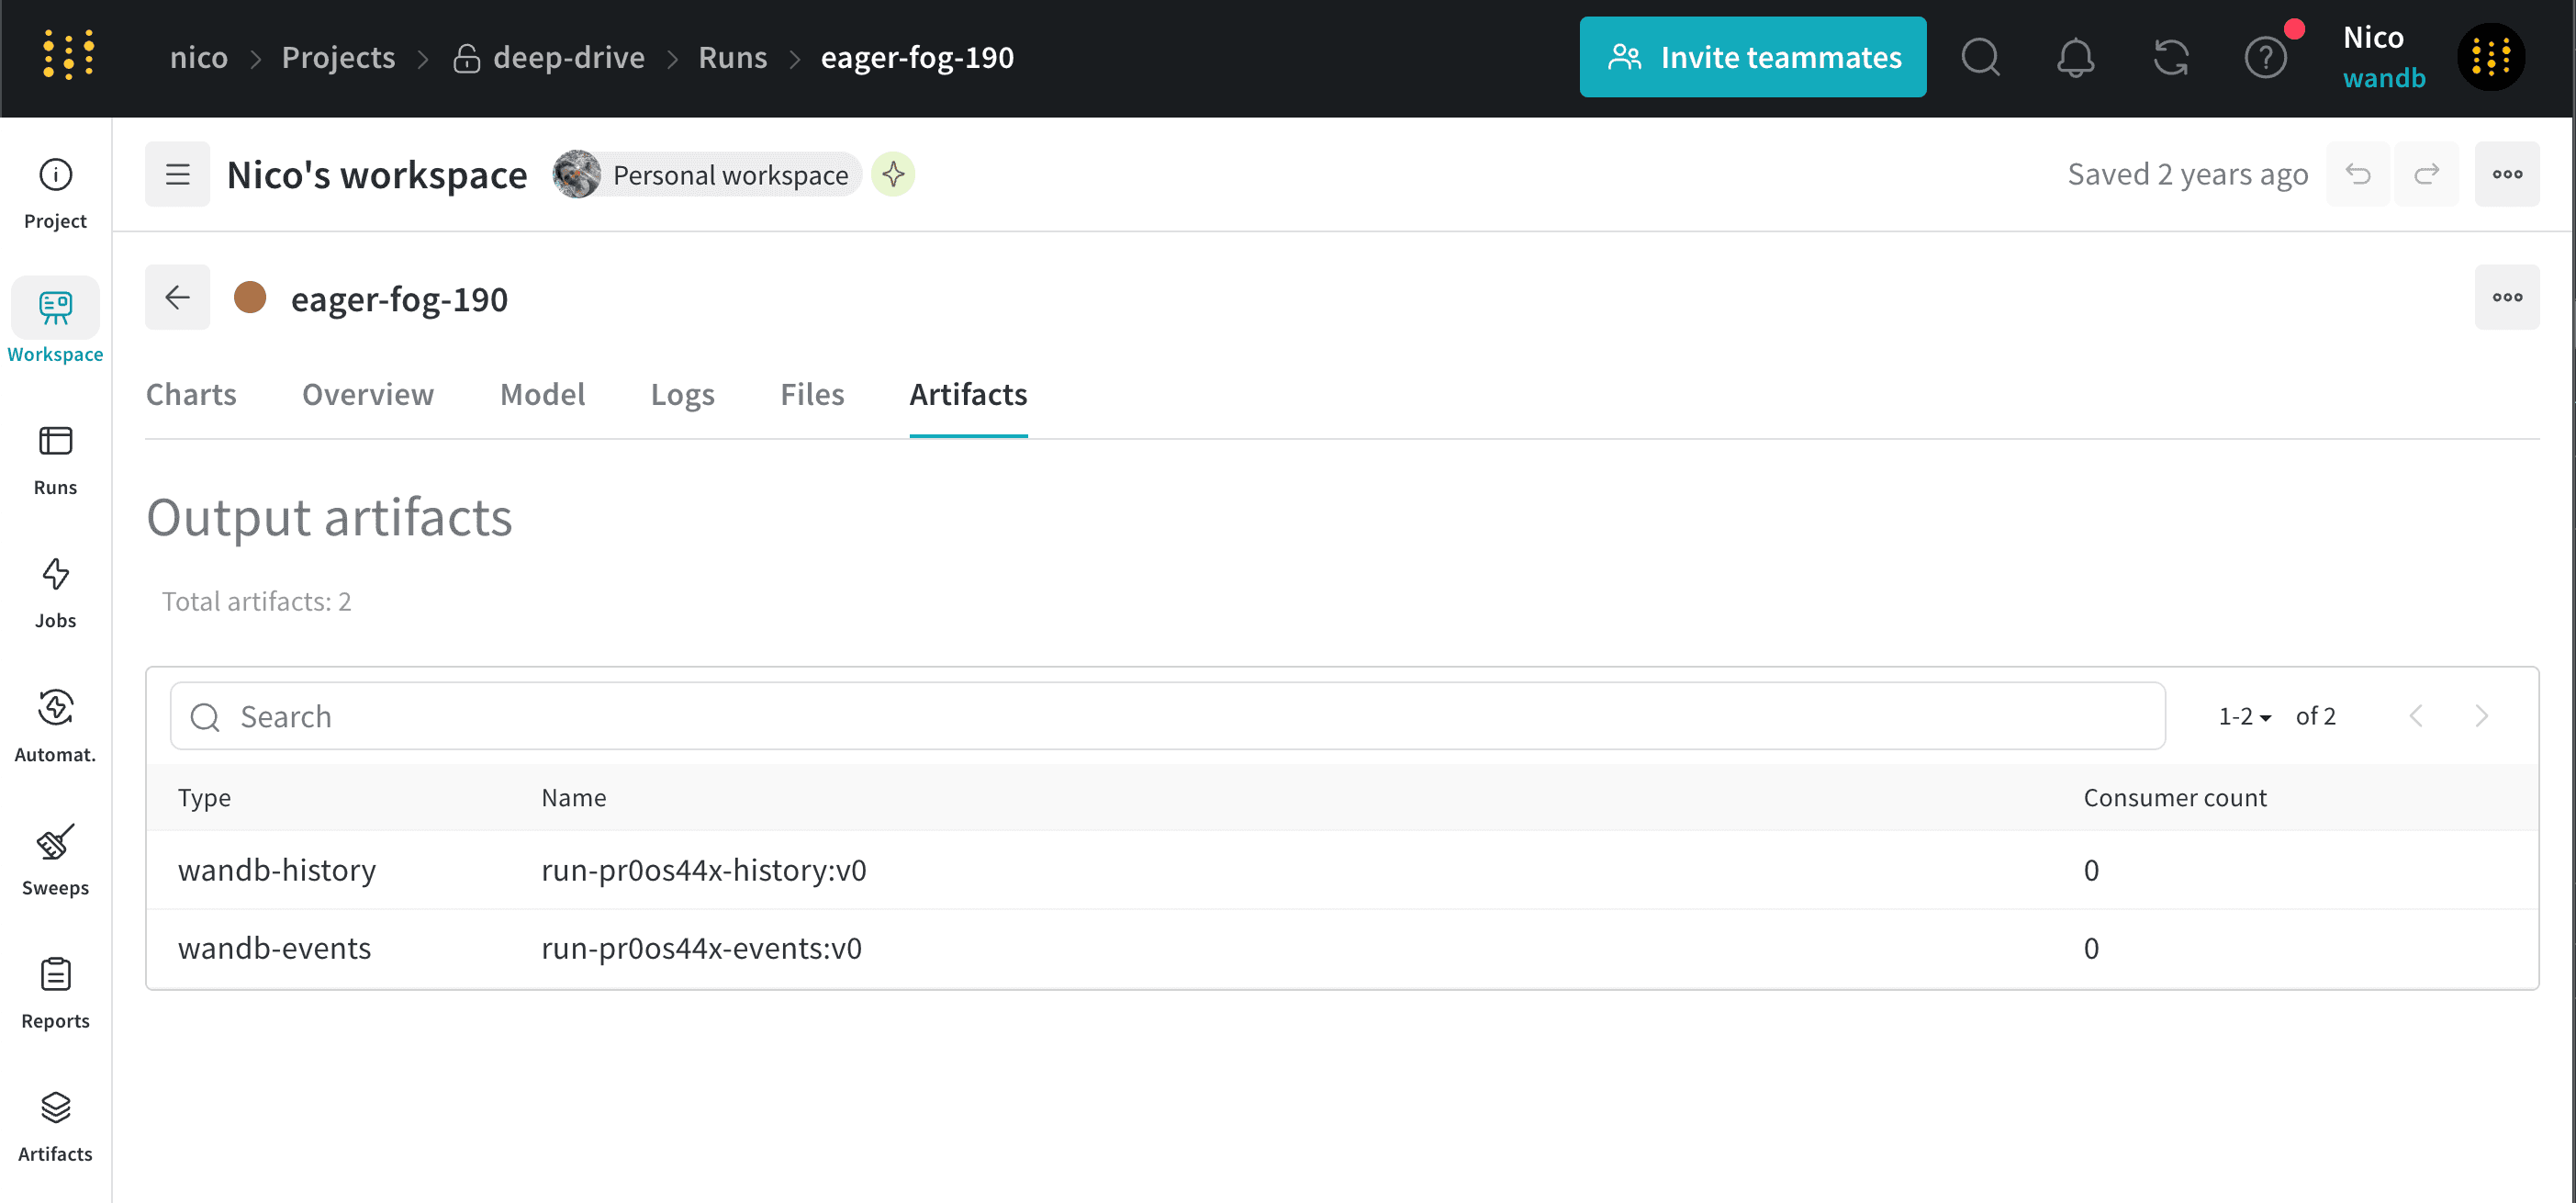
The Artifacts tab lists the input and output artifacts for the specified run.