

- Pinned runs: Pin runs from any project in your workspace to keep them visible at the top of the runs list. You can pin up to 20 runs in a workspace, including runs from other projects.
- Baseline run: Specify a baseline run as your reference point for comparisons. The baseline run is always visible in the workspace and at the top of the runs list. In the runs table, summary metric deltas show how each run compares to the baseline. In line plots, the baseline appears with visually distinct styling to help with comparison.
- Comparing new experiments against your production model.
- Comparing runs across projects.
- Creating a baseline for your experiments to evaluate how new runs perform against it.
- Tracking multiple candidate models during experimentation.
- Evaluating whether new runs improve on your best results.
Pin runs
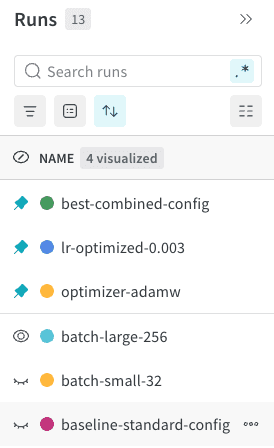
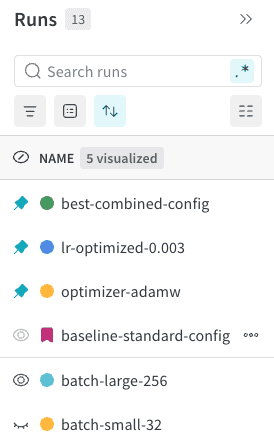
Pin runs to keep them easily accessible at the top of your workspace. To hide a pinned or baseline run, click the icon. To show a hidden run, click the icon. Pinned runs appear at the top of the run selector with a circular pin icon, separated from other runs by a visual divider. To pin a run:- Navigate to your workspace.
- In the run selector or runs table, find the run you want to pin.
- Click the action () menu, then select Pin run.
Compare runs across projects
Compare runs from different projects by selecting runs from another project and pinning them to your current workspace.- Navigate to your project’s workspace.
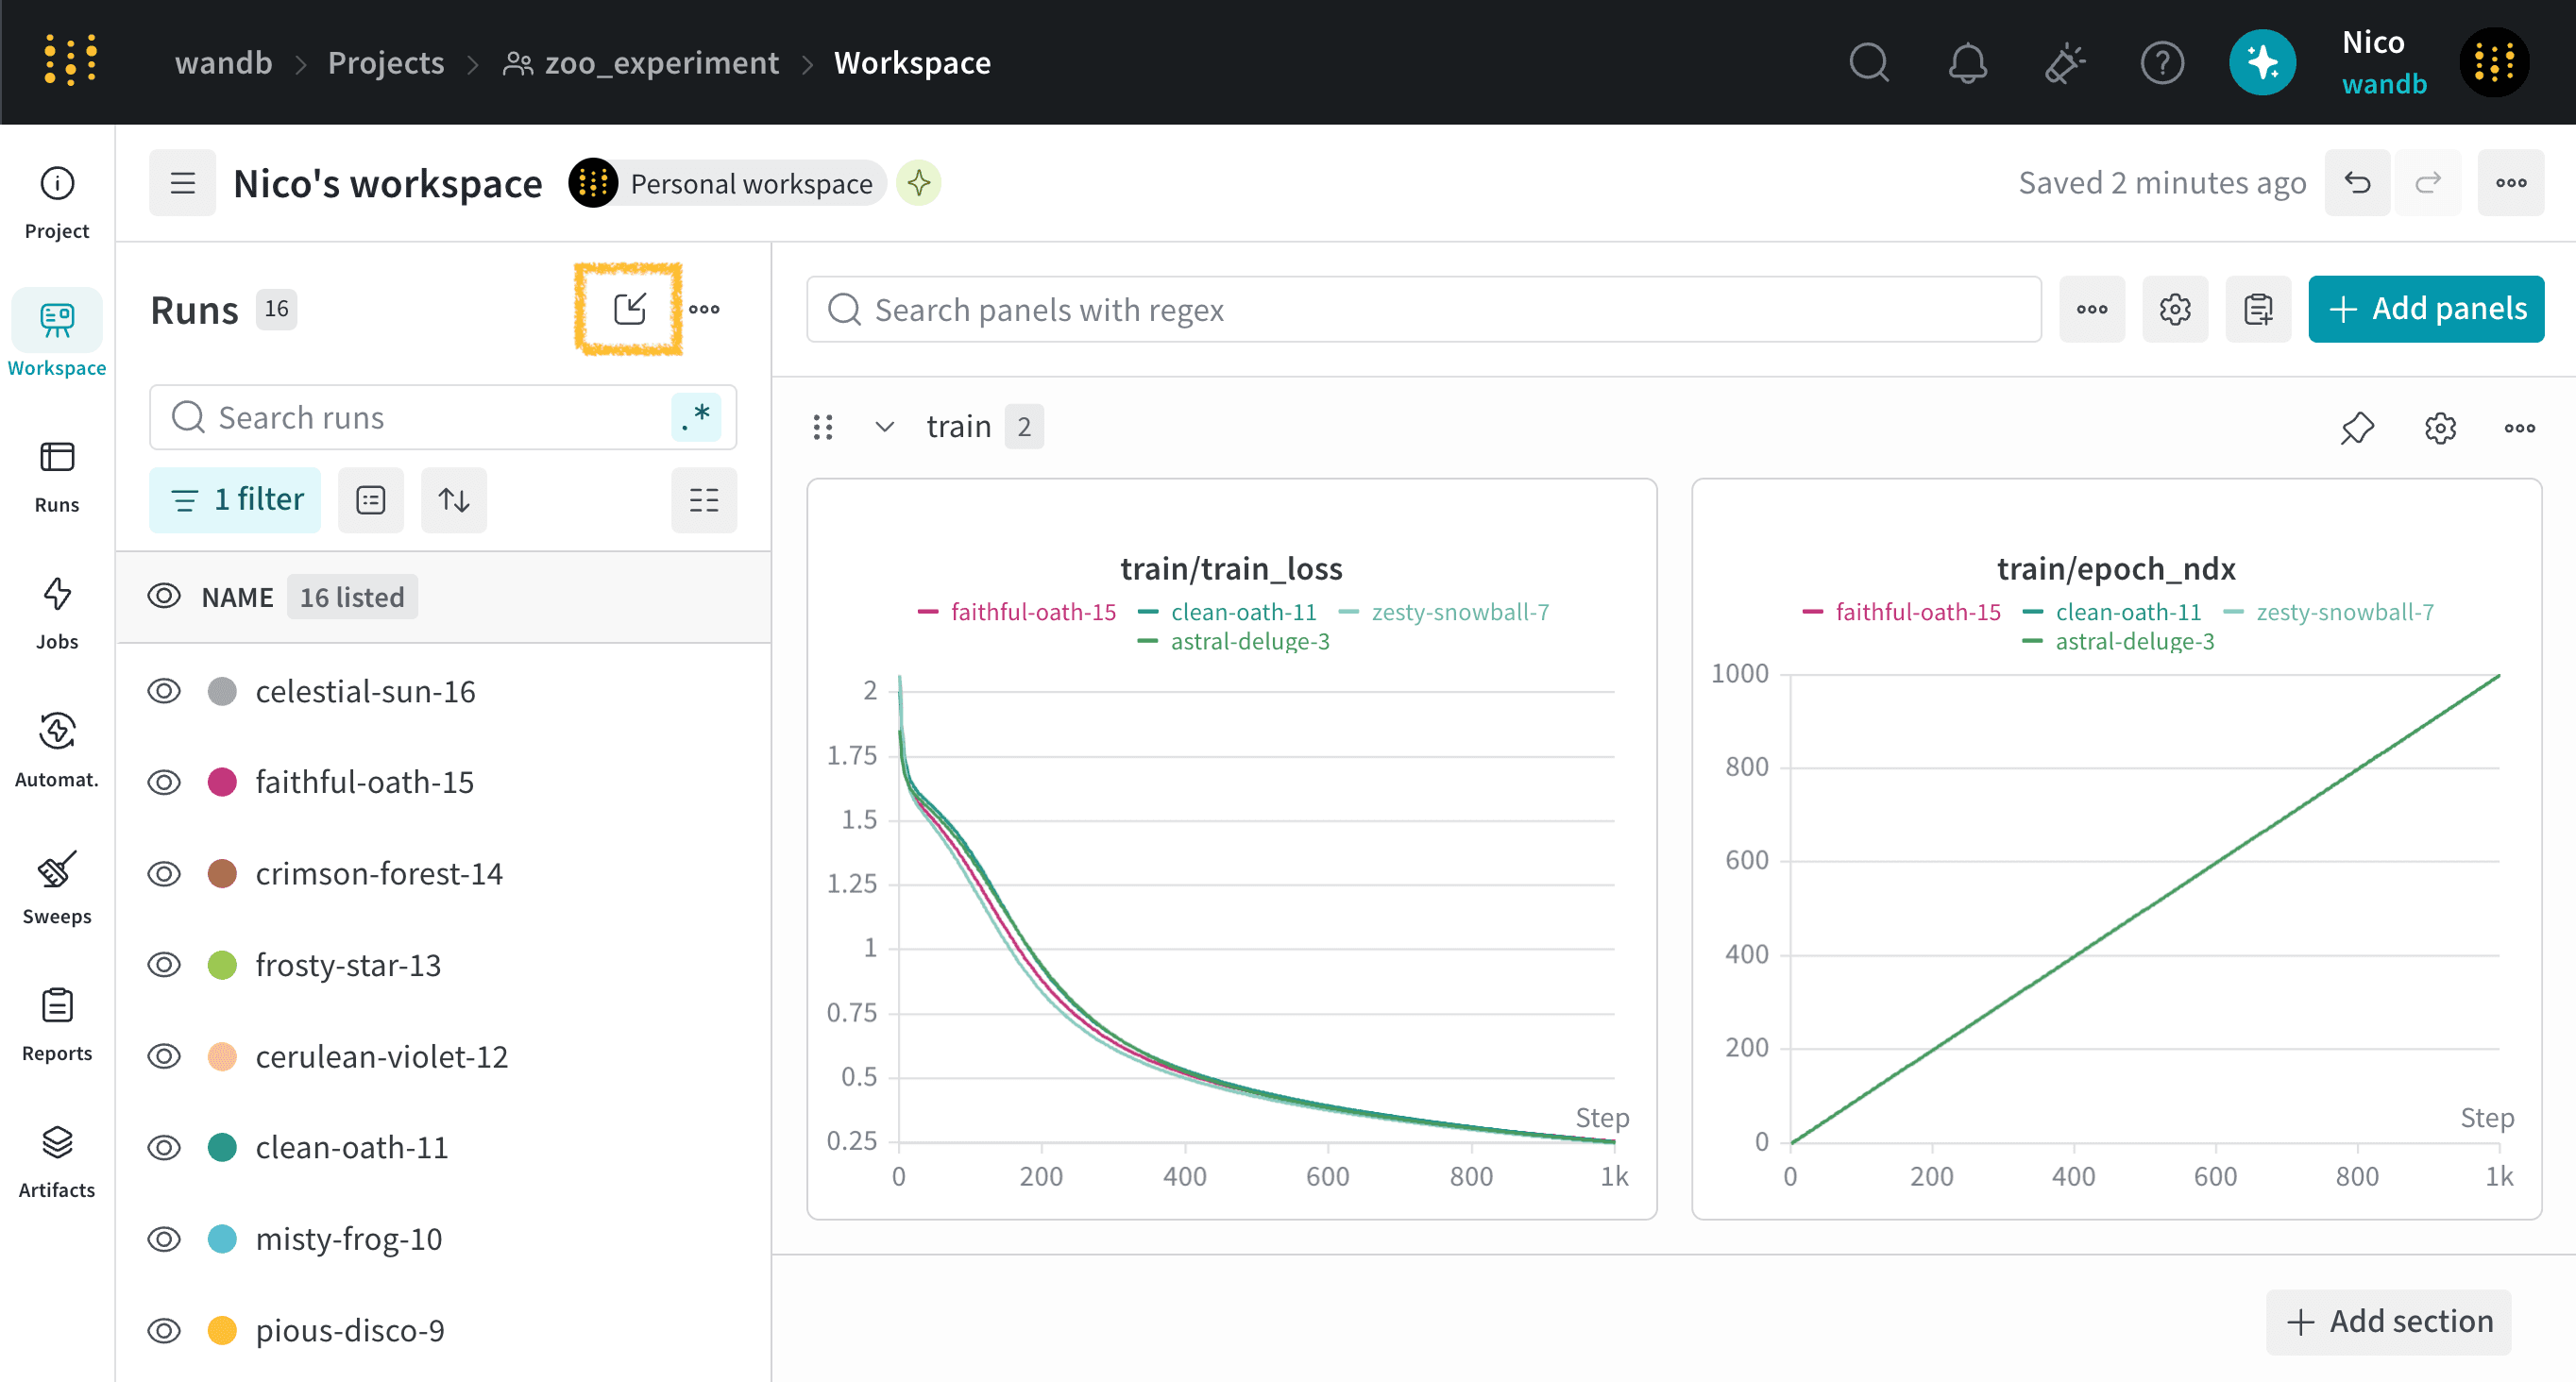
- Click on the Select runs from another project button (small square box with rounded corners and a diagonal arrow) at the top of your workspace’s run selector or the runs table.
- In the modal, select a project from the Source project dropdown.
- Search the source project’s runs to find the run you want to compare. You can search by run name or unique ID.
- Select the checkbox next to each run you want to compare, then click Pin runs.
Manage and compare a baseline run
You can designate one run as the workspace baseline to use as a reference point for evaluating other runs. In the runs selector and runs table, the baseline run appears at the top alongside pinned runs, and has a bookmark icon instead of a pin. In line plots, lines for the baseline run appear bolder than other lines. When you hover over the plot or legend, the baseline run’s line appears dashed.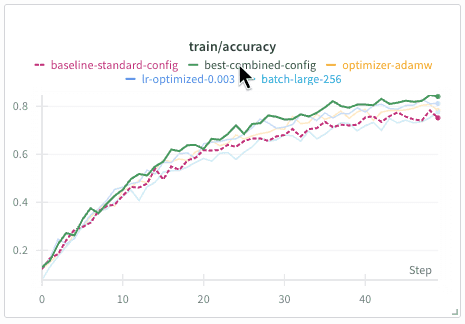
Set a baseline run
Designate a run as the workspace baseline to evaluate other runs against it. To set a baseline run:- Navigate to your workspace.
- In the run selector or runs table, find the run you want to use as your baseline.
- Click the action () menu, then select Set as baseline.
Change the baseline run
Only one run can be the baseline at a time. To change which run is your baseline:- Navigate to your workspace.
- In the run selector or runs table, find the run you want to use as your new baseline.
- Click the action () menu, then select Replace baseline. If the menu item is inactive, ensure that you have at least one pinning slot available. If necessary, unpin a pinned run by clicking the circular pin icon next to a pinned run.
- The new run becomes the baseline, and W&B automatically pins the previous baseline so you can find it. Optionally, unpin it by clicking its pin icon.
Remove the baseline designation
To remove the baseline designation:- Navigate to your workspace.
- In the run selector or runs table, find the current baseline run.
- Click the action () menu, then select Remove baseline. If the menu item is inactive, ensure that you have at least one pinning slot available. If necessary, unpin a pinned run by clicking the circular pin icon next to a pinned run.
- W&B automatically pins the previous baseline so you can find it. Optionally, unpin it by clicking its pin icon.
Compare runs to the baseline
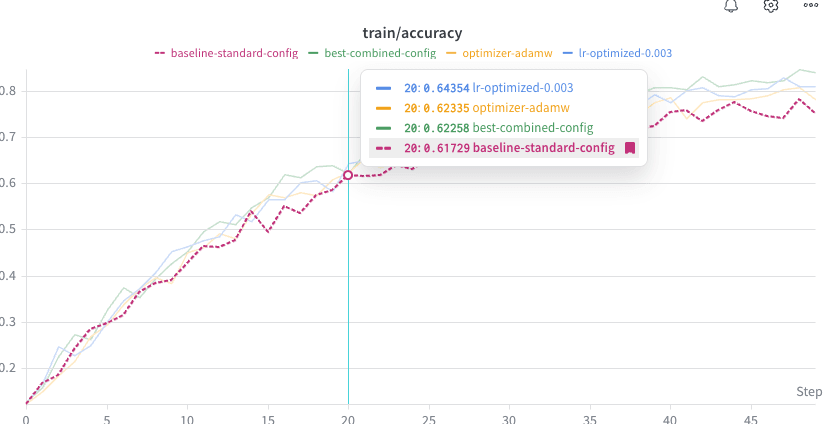
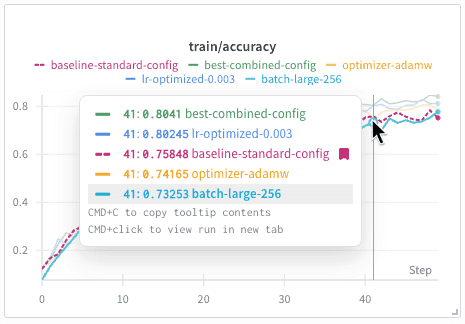
After you set a baseline, you can compare other runs against it in line plots and the runs table. The baseline run stays visible in line plots for metrics it has logged. Its lines appear bolder than other runs.- Hover over a part of the plot to display a tooltip with values for all visible runs, including the baseline run and pinned runs.
- Hover over the baseline run’s legend label to display the line prominently. It appears as a heavy dashed line. Lines for other visible runs appear with reduced saturation.
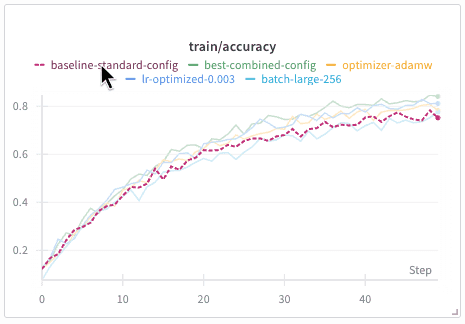
- Hover over another run’s legend label to display that run’s line prominently and compare it with the baseline, which appears as a heavy dashed line. Lines for other visible runs appear with reduced saturation.
Summary metric deltas
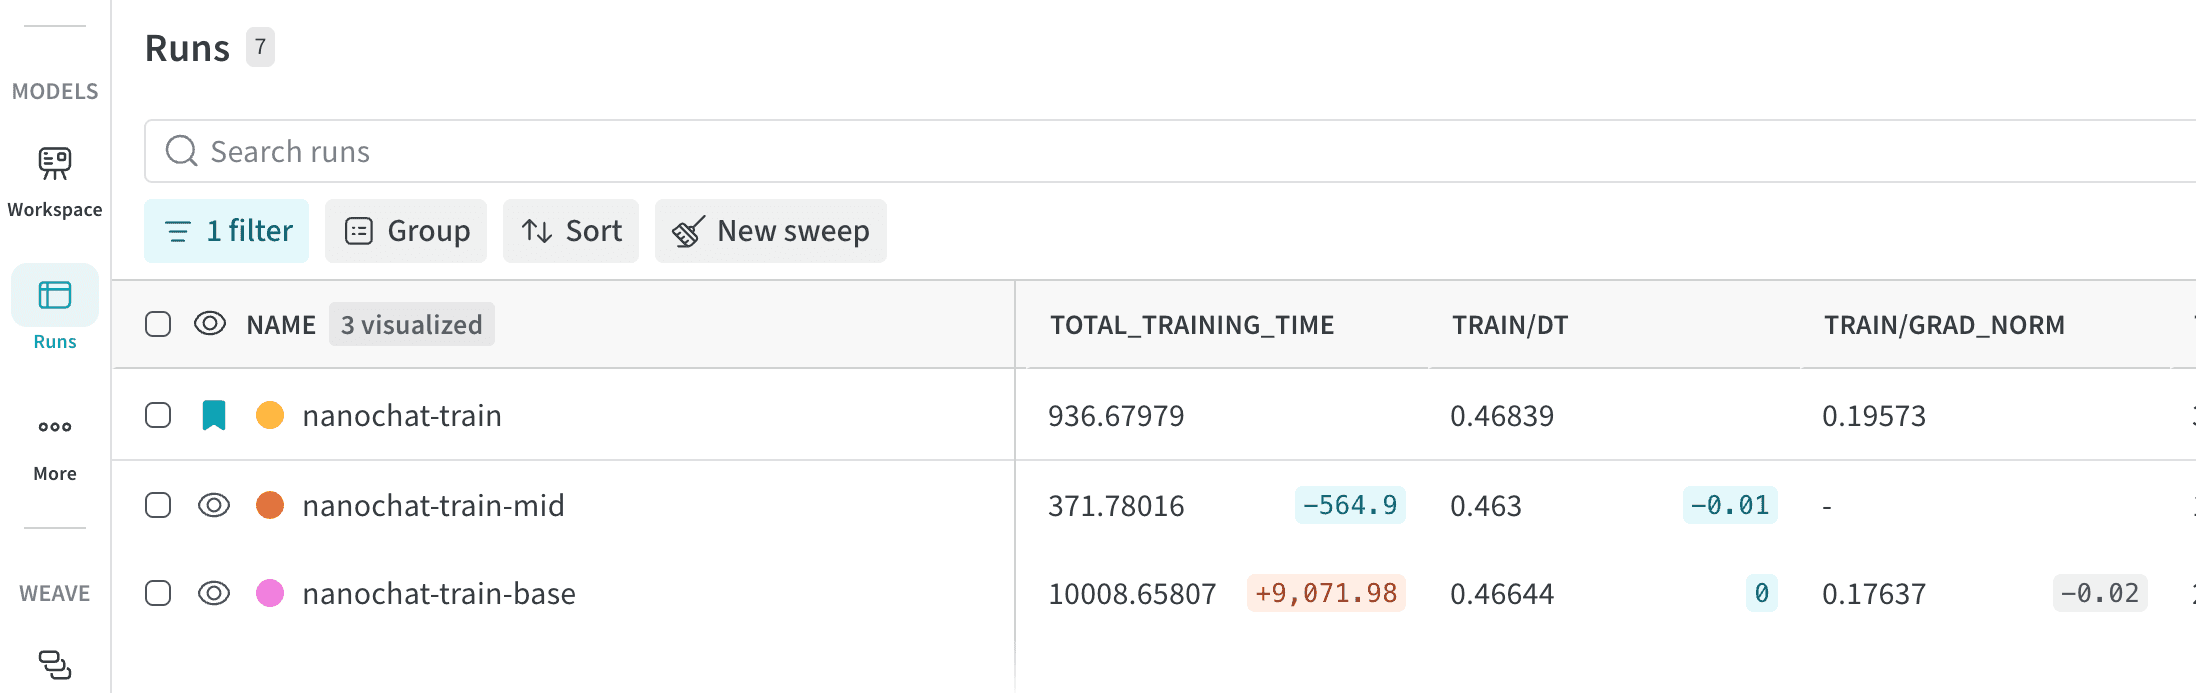
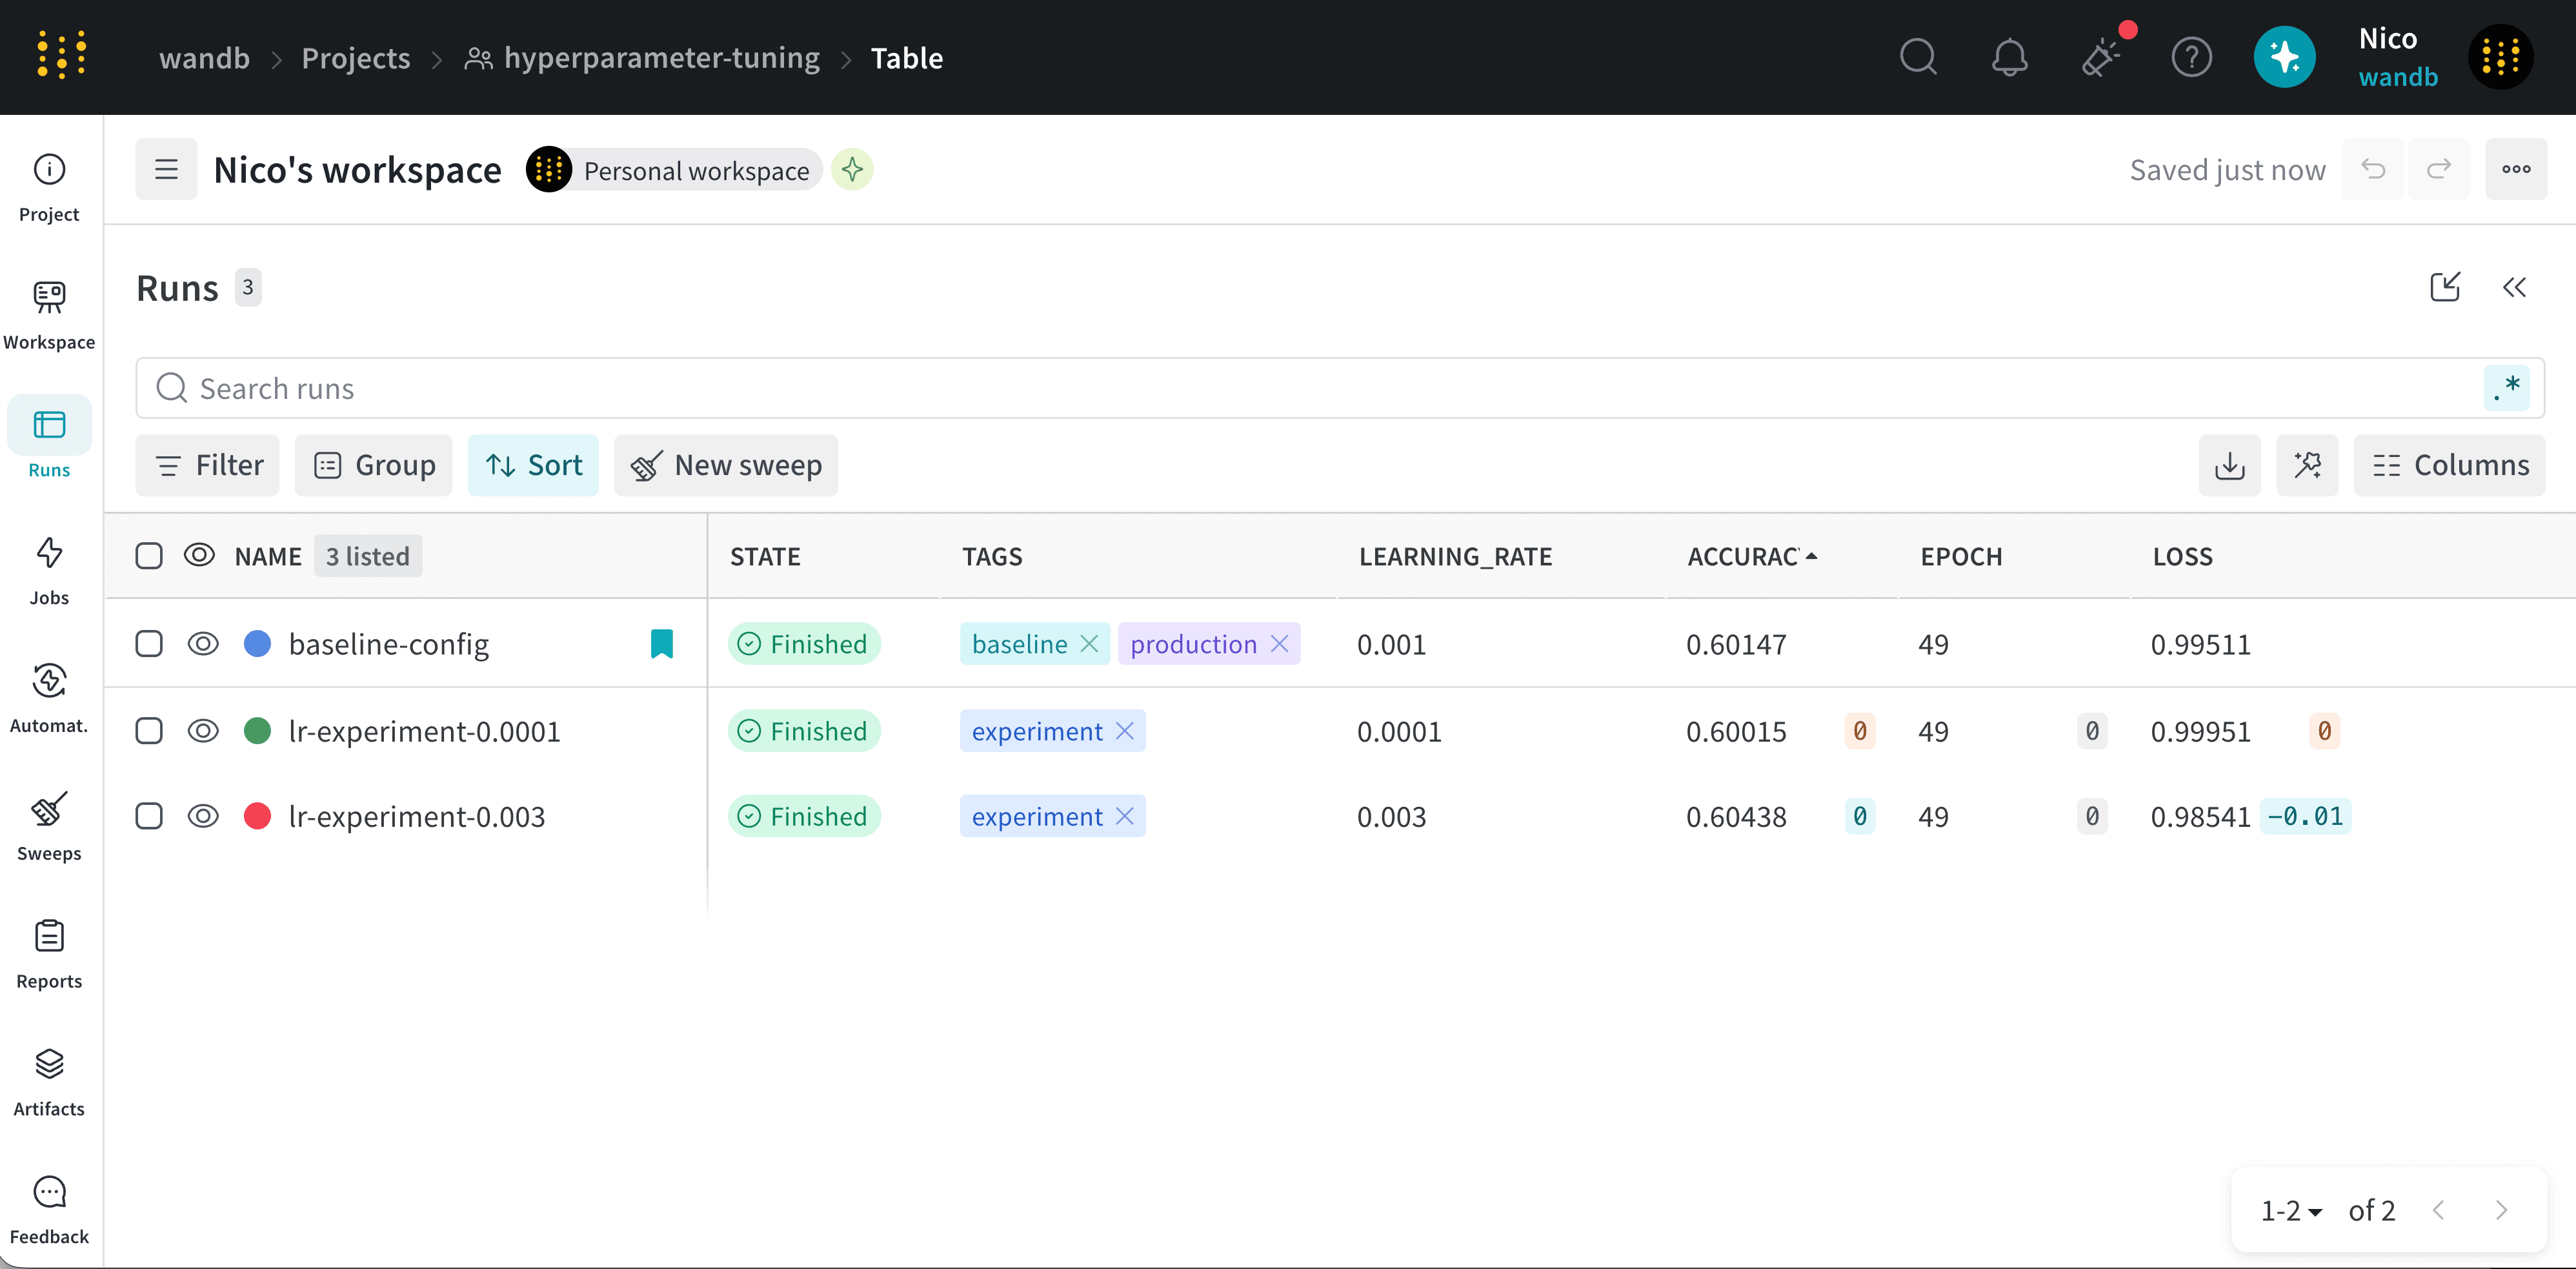
When you set a run as the baseline, every other run that logs the same summary metric shows the delta from the baseline by default. The delta, or amount of change, appears to the right of the metric value in the run’s row in the runs table. By default, the delta uses dark gray text and a dark gray background. To turn on semantic coloring for quick visual reference, set the Metric directionality for a column. When directionality is set:- If the other run outperforms (is directionally better than) the baseline, the delta appears as dark red text with a light red background.
- If the other run underperforms (is directionally worse than) the baseline, the delta appears as dark teal text with a light teal background.
- In the runs table, hover over the column heading for the metric.
- Click the action () menu that appears.
- Set Metric directionality to Higher values are best or Lower values are best.
nanochat-train-base and nanochat-train-mid compare with the baseline run nanochat-train. Delta metrics appear for TOTAL_TRAINING_TIME, TRAIN/DT, and TRAIN/GRAD_NORM.
Hide summary metric deltas in a workspace
By default, a workspace with a baseline run always displays summary metric deltas. To hide summary metric deltas in a workspace:- In the workspace, click Settings.
- In the drawer that appears, click Runs.
- In the Baseline tab, toggle Show value deltas in the runs table.
- Close the workspace settings drawer.
Use cases
The following scenarios show how pinned and baseline runs can help guide your experiments.- Track production models: Ensure that new models meet your quality bar before deployment.
- Set your production model as the baseline.
- Compare all experiments against your deployed model to identify candidates that outperform production.
- Compare hyperparameter experiments: Evaluate hyperparameter sweeps or manual experiments against your best-known configuration.
- Set your best-known configuration as the baseline.
- Pin promising candidates as you discover them.
- Use line plots to compare runs against the baseline.
- Continue to update the baseline as you find better configurations.
Example: Compare runs from hyperparameter tuning experiments
This section illustrates how pinned and baseline runs can help you to compare runs. For example, the following code simulates a hyperparameter-tuning scenario with a series of runs.- Navigate to your W&B project.
- Select the Runs tab.
-
Filter for the run that has the
baselinetag and set it as your baseline run. -
Pin
baseline-configto make the run visible at the top of the runs table. -
Compare the experiment runs against the baseline.
- Select the vertical ellipsis menu next to the
accuracycolumn, then set Metric directionality to Higher values are best. The delta for each run’s accuracy is now shown in the runs table. - Select the vertical ellipsis menu next to the
losscolumn, then set Metric directionality to Lower values are best. The delta for each run’s loss is now shown in the runs table.
- Select the vertical ellipsis menu next to the
-
Use the line plots to visually compare the runs against the baseline. The baseline run appears with a bold dashed line, and you can hover over the plot to see how each run compares at a given epoch.
For example, the following image shows how the runs
lr-experiment-0.003andlr-experiment-0.0001compare with the baseline runbaseline-config.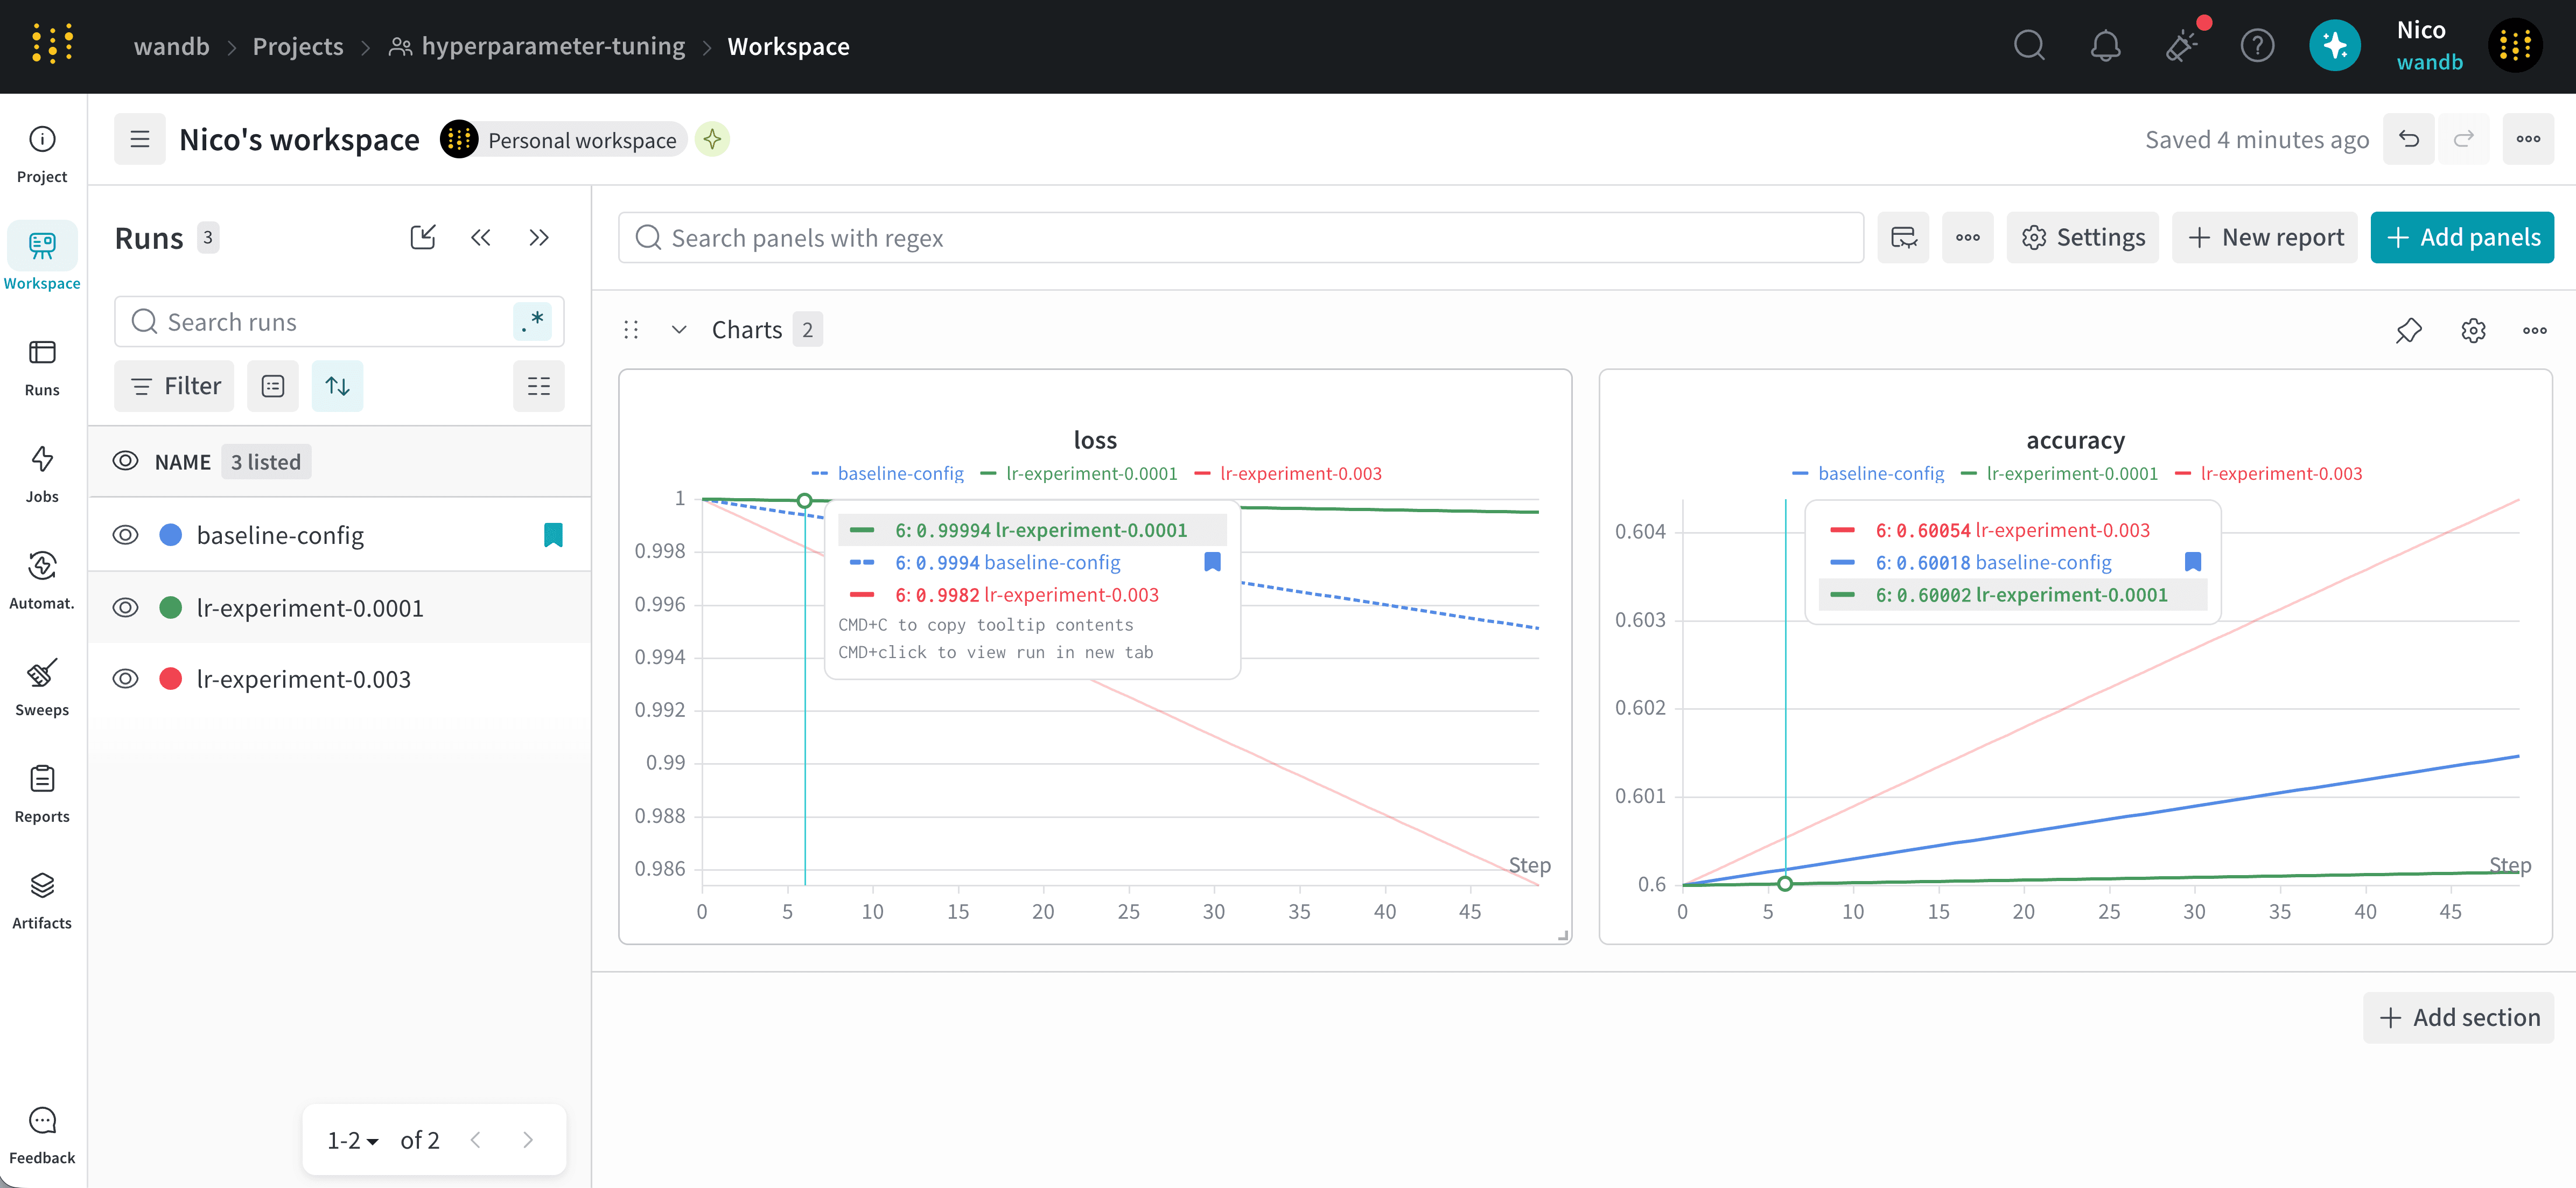
Limitations
The following features aren’t supported for pinned and baseline runs:- Grouping: When viewing runs in the run selector or runs table, if runs are grouped by a column, pinned and baseline runs aren’t visually distinct from other runs.
- Reports: In a run set in a W&B Report, pinned and baseline runs aren’t visually distinct from other runs.
- Workspace view only: The baseline doesn’t appear when viewing a single run’s workspace.
- Line plots only: Baseline comparison is available only for line plots, not for other panels such as bar plots or media panels.