> ## Documentation Index
> Fetch the complete documentation index at: https://wb-21fd5541-style-guide-models-runs-20260604-113608.mintlify.site/llms.txt
> Use this file to discover all available pages before exploring further.
# View runs in a project
> Details about customizing how runs are displayed in your project's runs table
This page describes how to view and customize the Runs table for a W\&B project so you can compare, sort, and organize runs to find the information that matters most.
View all runs logged to your W\&B project in the **Runs** tab of your project sidebar. The Runs tab contains the **Runs table**, which shows details about all of your runs in a project. Use the Runs table to compare runs, sort runs by specific columns, and organize runs into groups.
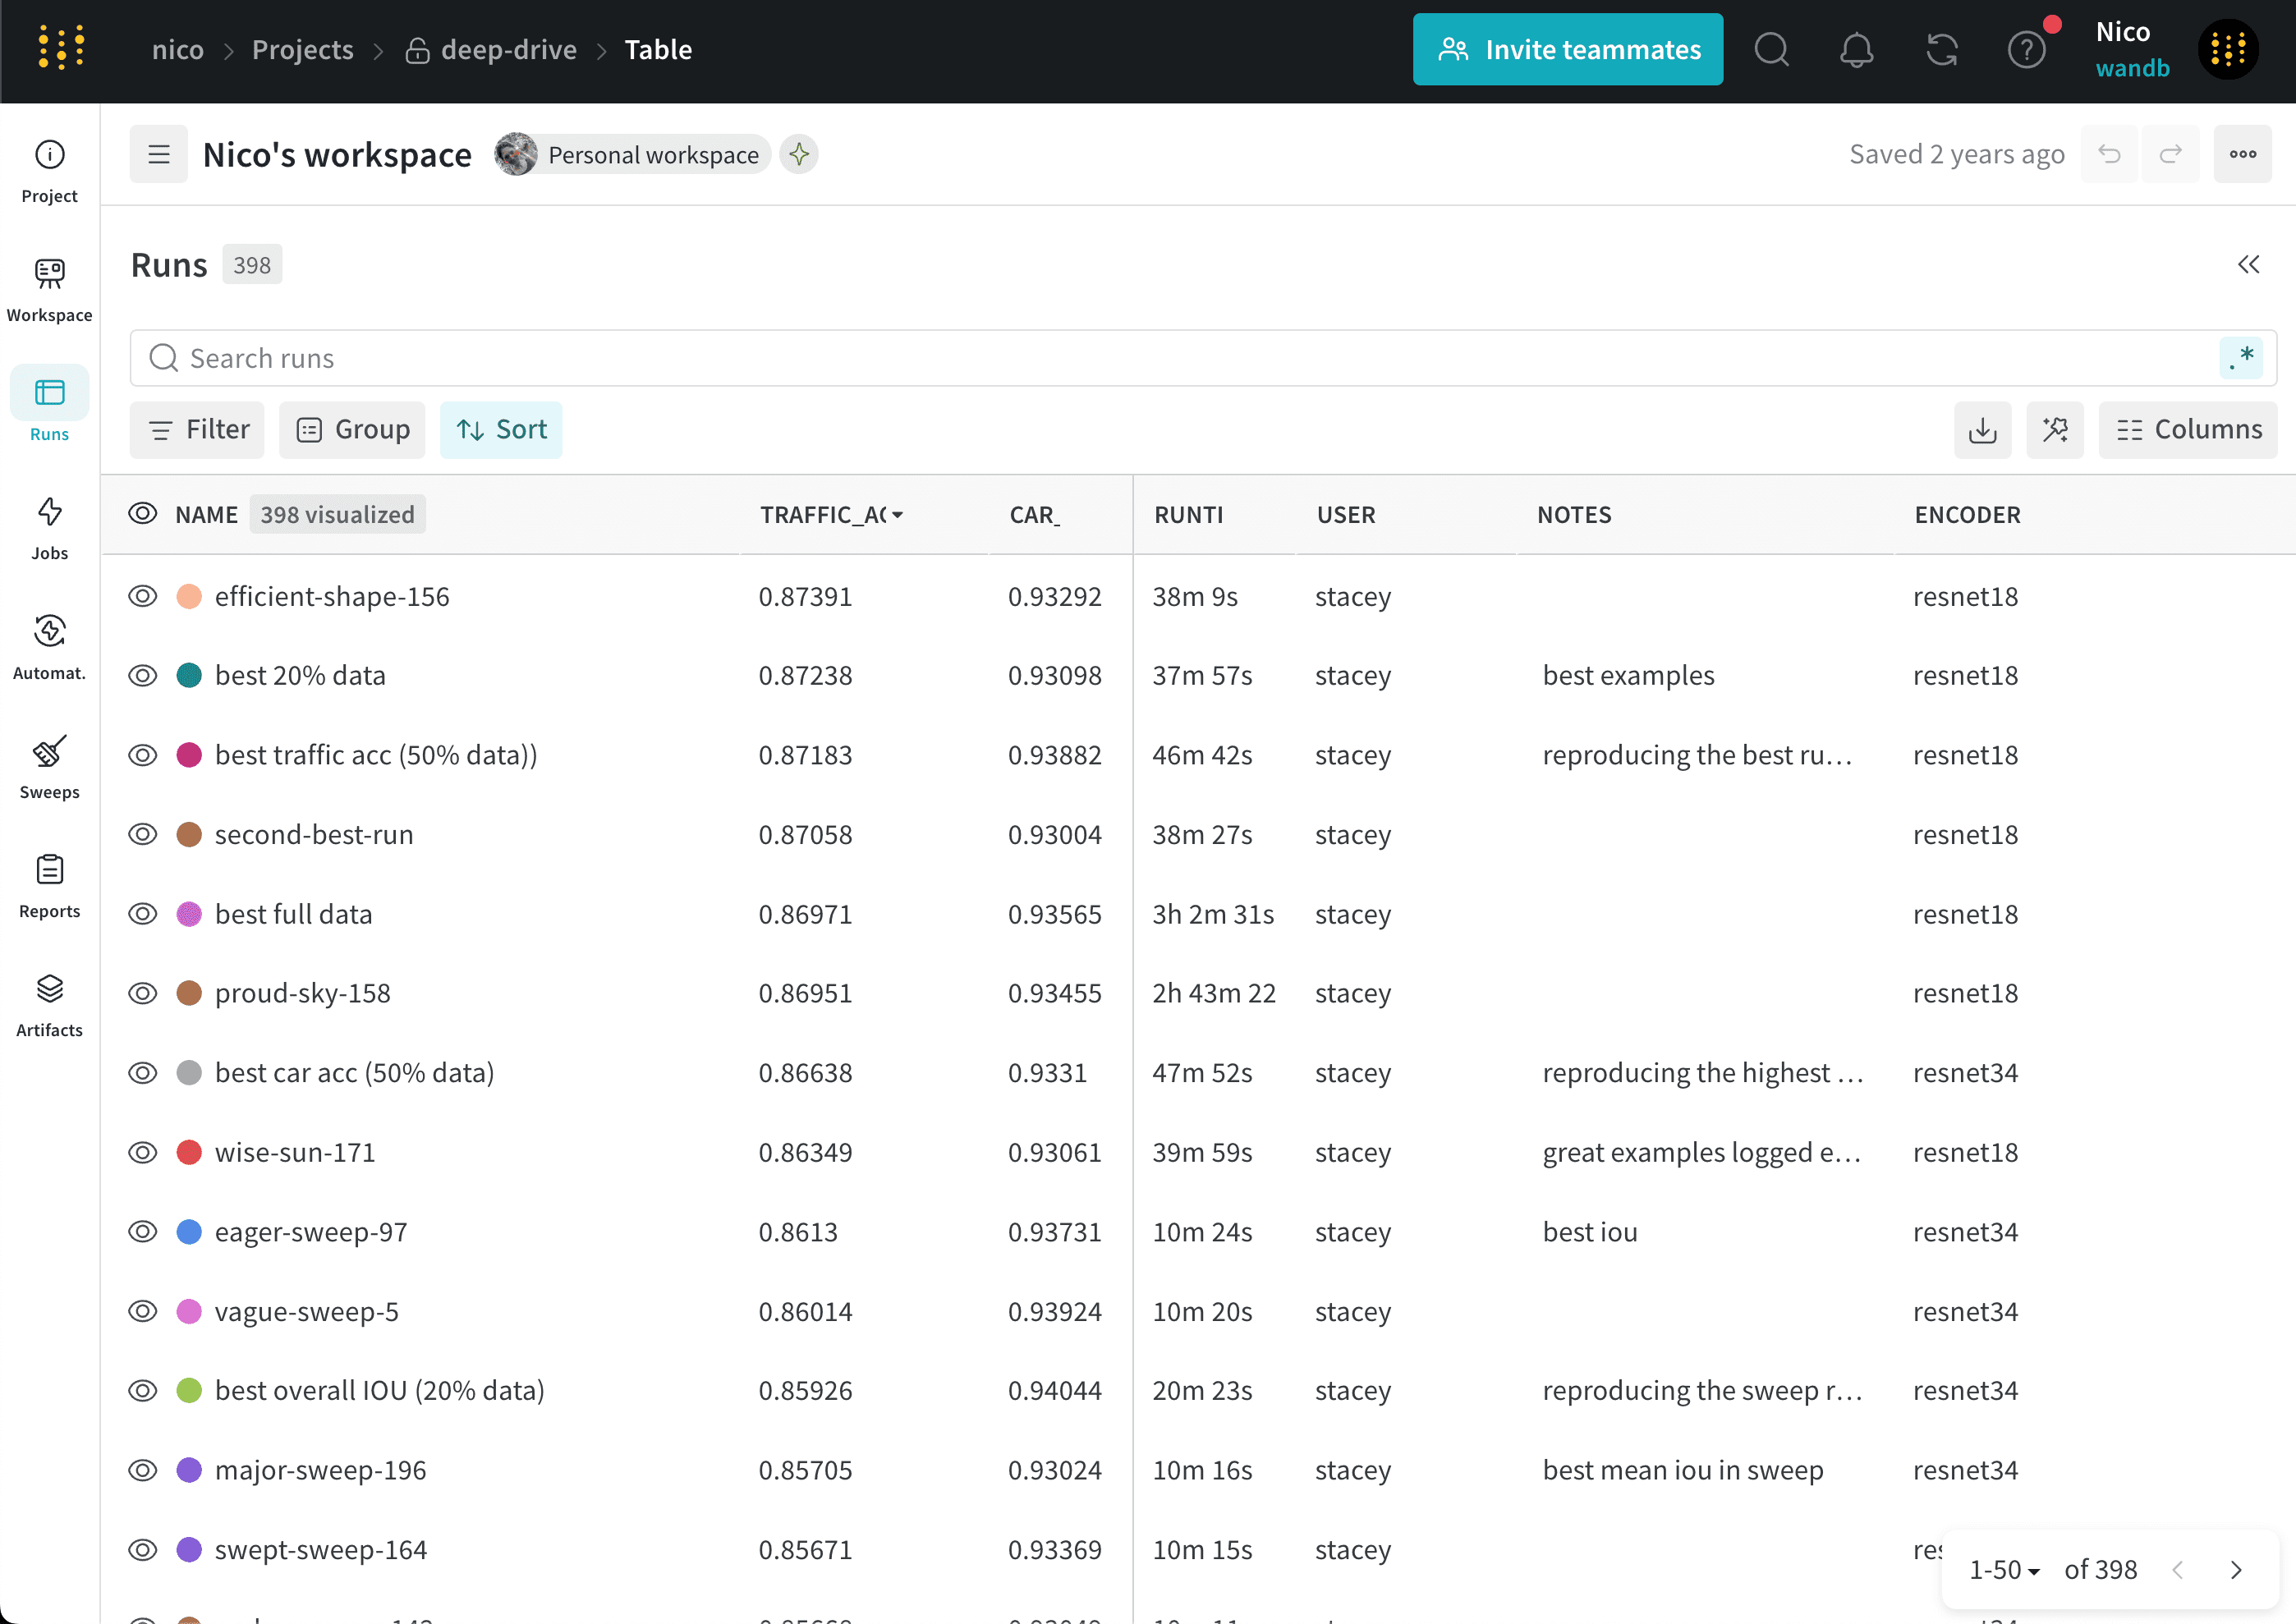
The following image shows the Runs table for a project named `deep-drive`:
 ## Manage columns
The following sections describe how to add, remove, move, pin, and hide columns to control which run properties appear in the Runs table.
### Add columns
Add columns in the Runs table to show additional properties associated with your project.
To add columns in the Runs table:
1. In the project sidebar, select the **Runs** tab.
2. Above the list of runs, click the **Columns** (six horizontal dashes) button.
3. Select the name of a property within the **Hidden** section of the modal.
4. Drag columns to change their order.
5. Click **Close**.
### Remove columns
Remove columns from the Runs table to hide properties you don't need to see.
To remove columns in the Runs table:
1. In the project sidebar, select the **Runs** tab.
2. Above the list of runs, click the **Columns** (six horizontal dashes) button.
3. Select the name of a property within the **Visible & Pinned** section of the modal.
4. Click **Close**.
### Move columns
Reorder columns to place the most relevant properties next to each other.
To move columns in the Runs table:
1. In the project sidebar, select the **Runs** tab.
2. Drag a column to the left or right.
### Pin columns
W\&B displays pinned columns on the left side of the Runs tab and unpinned columns on the right side. If you pin a column in the **Runs** tab, W\&B also pins it in the **Workspace** tab. Similarly, if you pin a column in the **Workspace** tab, W\&B also pins it in the **Runs** tab.
To pin a column:
1. In the project sidebar, navigate to the **Runs** tab.
2. Click the **Columns** (six horizontal dashes) button.
3. Within the **Visible & Pinned** section of the modal, click the pin icon next to the column name you want to pin.
To unpin a column:
1. In the project sidebar, navigate to the **Runs** tab.
2. Hover over the column name, then click its **action ()** menu. Alternatively, click the **Columns** (six horizontal dashes) button and click the pin icon next to the column name you want to unpin.
3. Click **Unpin column**.
W\&B persists columns you pin or unpin in the Runs table to the Runs selector of the Workspace tab.
### Hide columns
Hide columns to remove individual properties from view without permanently removing them.
To hide columns in the Runs table:
1. In the project sidebar, select the **Runs** tab.
2. Hover over the column name, then click its **action ()** menu.
3. Click **Hide column**.
To view all hidden columns, click **Columns**.
## Sort runs by column
Sort runs by any visible column in the Runs table. Sorting helps you identify the best or worst recorded value for a metric.
To sort the list of runs by any visible column:
1. Hover over the column name, then click its **action ()** menu.
2. Optional: Hover over **Show latest**. From the dropdown, select **latest**, **min**, or **max**.
3. Click **Sort ascending** or **Sort descending**.
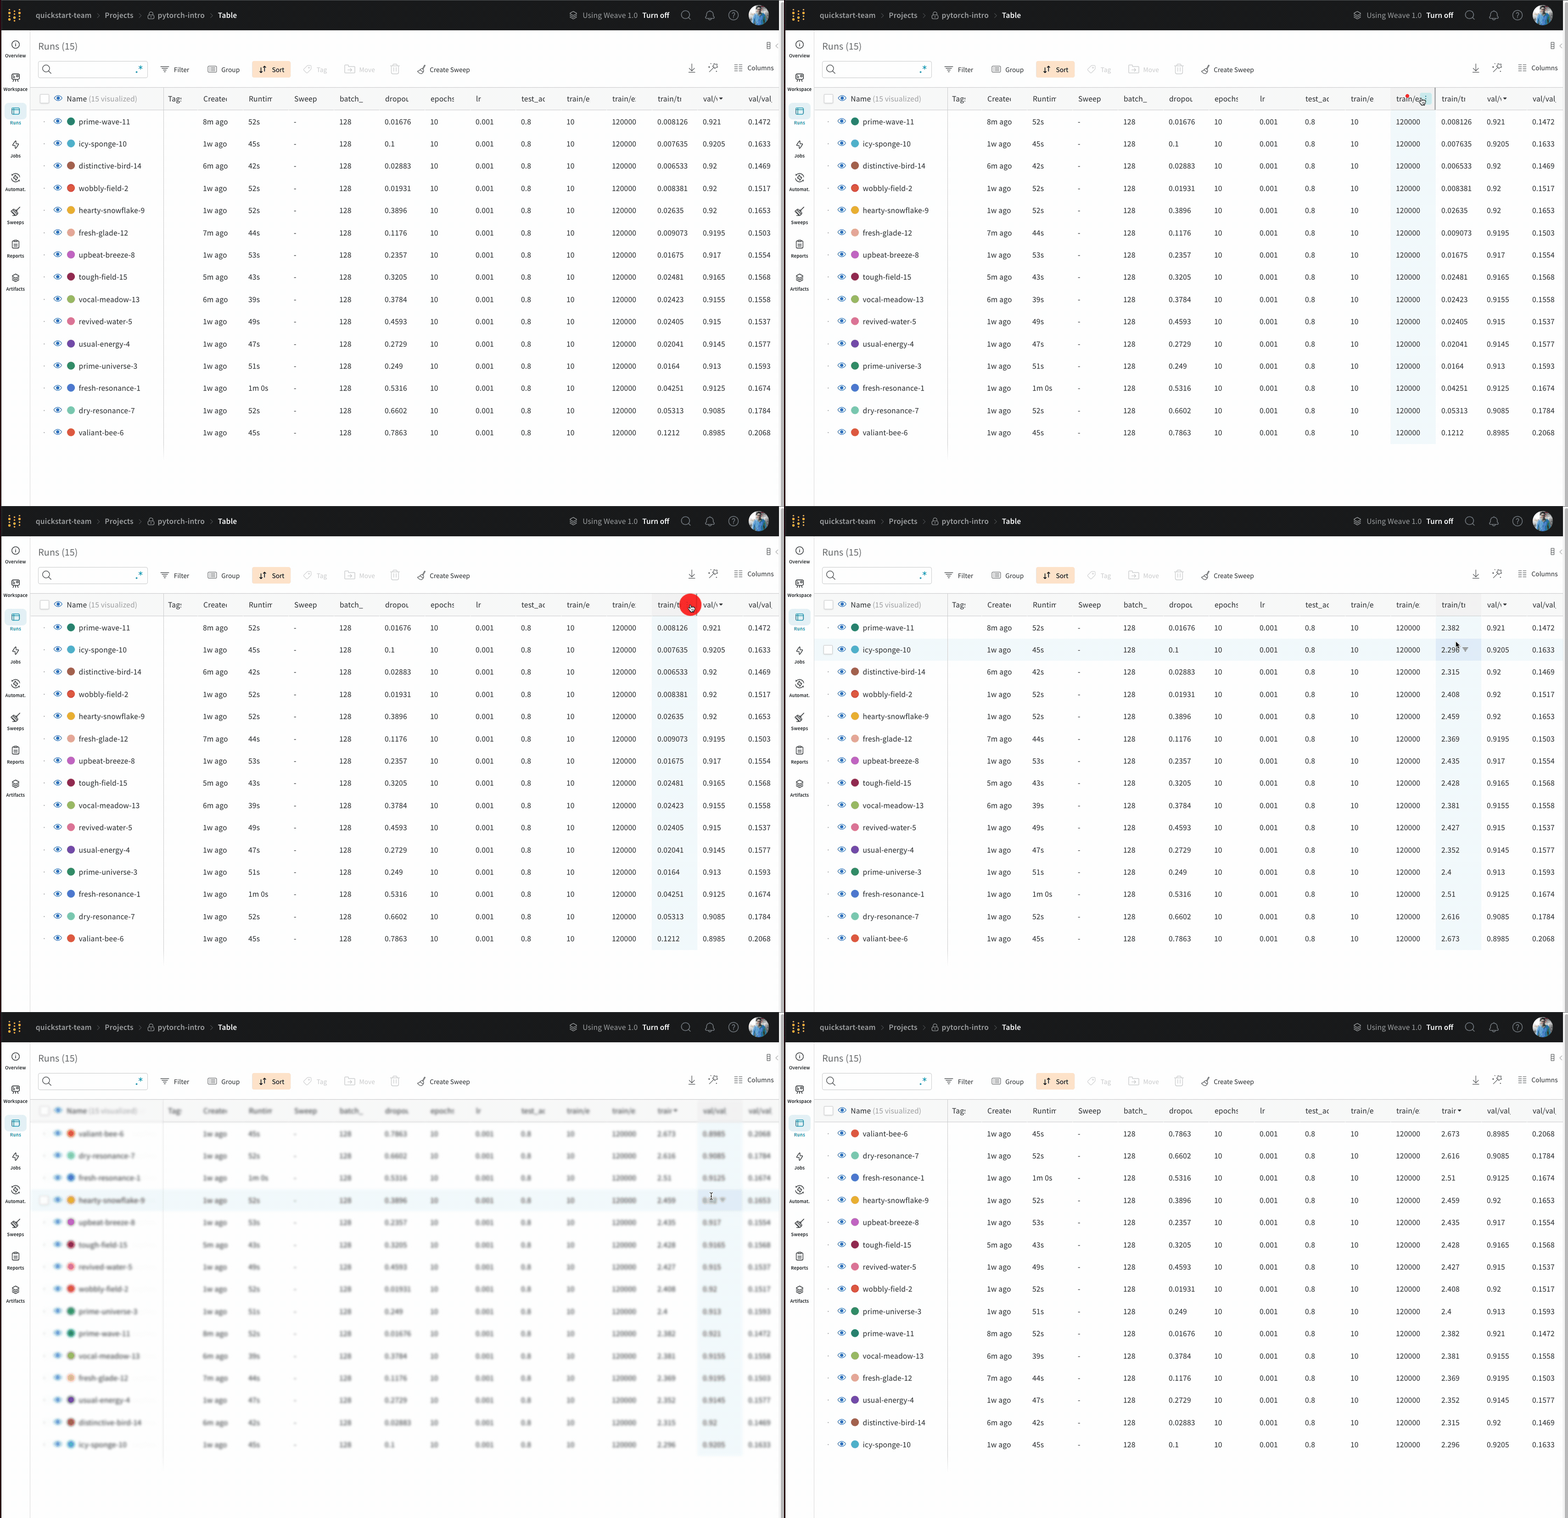
The following animation shows sorting runs by the maximum value of a logged metric:
## Manage columns
The following sections describe how to add, remove, move, pin, and hide columns to control which run properties appear in the Runs table.
### Add columns
Add columns in the Runs table to show additional properties associated with your project.
To add columns in the Runs table:
1. In the project sidebar, select the **Runs** tab.
2. Above the list of runs, click the **Columns** (six horizontal dashes) button.
3. Select the name of a property within the **Hidden** section of the modal.
4. Drag columns to change their order.
5. Click **Close**.
### Remove columns
Remove columns from the Runs table to hide properties you don't need to see.
To remove columns in the Runs table:
1. In the project sidebar, select the **Runs** tab.
2. Above the list of runs, click the **Columns** (six horizontal dashes) button.
3. Select the name of a property within the **Visible & Pinned** section of the modal.
4. Click **Close**.
### Move columns
Reorder columns to place the most relevant properties next to each other.
To move columns in the Runs table:
1. In the project sidebar, select the **Runs** tab.
2. Drag a column to the left or right.
### Pin columns
W\&B displays pinned columns on the left side of the Runs tab and unpinned columns on the right side. If you pin a column in the **Runs** tab, W\&B also pins it in the **Workspace** tab. Similarly, if you pin a column in the **Workspace** tab, W\&B also pins it in the **Runs** tab.
To pin a column:
1. In the project sidebar, navigate to the **Runs** tab.
2. Click the **Columns** (six horizontal dashes) button.
3. Within the **Visible & Pinned** section of the modal, click the pin icon next to the column name you want to pin.
To unpin a column:
1. In the project sidebar, navigate to the **Runs** tab.
2. Hover over the column name, then click its **action ()** menu. Alternatively, click the **Columns** (six horizontal dashes) button and click the pin icon next to the column name you want to unpin.
3. Click **Unpin column**.
W\&B persists columns you pin or unpin in the Runs table to the Runs selector of the Workspace tab.
### Hide columns
Hide columns to remove individual properties from view without permanently removing them.
To hide columns in the Runs table:
1. In the project sidebar, select the **Runs** tab.
2. Hover over the column name, then click its **action ()** menu.
3. Click **Hide column**.
To view all hidden columns, click **Columns**.
## Sort runs by column
Sort runs by any visible column in the Runs table. Sorting helps you identify the best or worst recorded value for a metric.
To sort the list of runs by any visible column:
1. Hover over the column name, then click its **action ()** menu.
2. Optional: Hover over **Show latest**. From the dropdown, select **latest**, **min**, or **max**.
3. Click **Sort ascending** or **Sort descending**.
The following animation shows sorting runs by the maximum value of a logged metric:
 W\&B persists the sort order you select in the Runs table to the Runs selector of the Workspace tab.
## Export the Runs table to CSV
To analyze your runs, hyperparameters, and summary metrics outside W\&B, export the Runs table to a CSV file with the download button:
1. In the project sidebar, select the **Runs** tab.
2. Above the list of runs, click the **Download** (downward arrow) button.
W\&B persists the sort order you select in the Runs table to the Runs selector of the Workspace tab.
## Export the Runs table to CSV
To analyze your runs, hyperparameters, and summary metrics outside W\&B, export the Runs table to a CSV file with the download button:
1. In the project sidebar, select the **Runs** tab.
2. Above the list of runs, click the **Download** (downward arrow) button.